
Integrated Tool for Urban Water Management
OVERVIEW
Lack of integrated water sector data for informed decision making for water related urban resilience that includes the various water related ecosystems.
Problem Statement
TEAM
Subarna Sadhu, Monica Thakur, Gaurang Patel, Abby Varghese
MENTORS
Mr. V.K Chaurasia; Mr. Victor Shinde
PILOT CITY
Chandigarh, India
ORGANIZATIONS
Ministry of Housing and Urban Affairs (MoHUA);
National Institute of Urban Affairs (NIUA);
Chandigarh Smart City Limited
ROLE
Project ideation, user research, user experience design, stakeholder engagement
Revive is a digital product developed under the India Smart Cities Fellowship Programme 2020-2021 addressing urban water management. It will acts as a dynamic decision support system that would assist the Urban Local Bodies in making informed choices in Urban Planning and Water Management. Currently, it is being piloted in Chandigarh Smart City and is to be hosted in SmartCode Repository.

Solution
Integrated tool for Urban Water Management that would act as a dynamic decision support system assisting ULB in making informed choices regarding urbanisation, water management, improve efficiency, identify sites at risk, flood management and sensitise citizens.
Approach


RESEARCH
Using the design thinking approach, we started exploring the context and did a SWOT analysis exercise for existing Indian Smart Cities. This gave us an overview of pressing problems and implementation challenges. It was followed by an ideation session where the entire cohort listed and discussed questions around the water sector.

The outcome of this ideation was streamlined into problem statements and possible solutions.
_pptx.jpg)
_pptx%20(1).jpg)
This was followed by:
-
Literature study to understand existing models of urban water management and best practices around the world
-
Stakeholder engagement
-
A combination of semi-structured interviews and observation to get a better understanding of the processes involved
-
User journey maps
User Personas


User Journey


IDEATION AND DESIGN
Based on research, we further streamlined the problem statement and clearly defined the project and design goals.
Project Goals
-
Monitor the water situation of the city in terms of efficiency and identify shortfalls
-
Predictive Modelling for Flood Simulation, Alternate Water, Smart Water
Design Goals
Information heavy dashboards often overwhelm the users and they find themselves lost in the middle of multiple options and scattered windows. During initial research it was also found that some dashboards provide short tutorials to address this problem, but that just adds another step into the process.
-
Intuitive and easy to navigate dashboard
-
Visualizing data and related analysis in a digestible layout
-
Communicating the information clearly
Challenges


Information Architecture
Initial Designs & Iterations
Once the wireframes were in place, we pitched the project to Chandigarh Smart City Limited for piloting. Before the data collection process, we ran a series of usability tests with potential users. This helped us in identifying the shortcoming in initial design and iterating it accordingly.

Sketches


Sketches
FINAL DESIGN


01. LANDING PAGE
All users will start from the landing page. For citizens, the landing page will have an option of lodging complaints and checking their water bills by being redirected to the respective city administration portals.
Along with this, the citizens will have an access to 'Open Dashboard' with limited datasets.

02. LOGIN
The ULB officials will have to ‘Log In’ with their credentials to access the entire dashboard.

03. REVIVE DASHBOARD
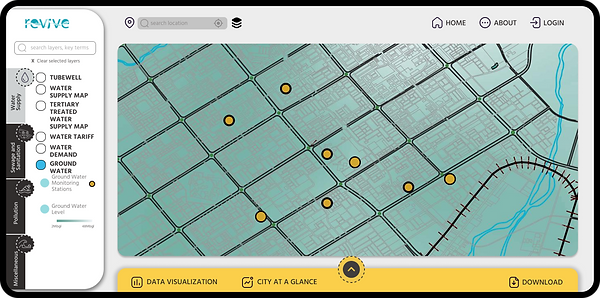
The dashboard has four major parameters and each parameter is further divided into layers and sublayers.

Users can switch layers on and off to overlay geospatial data to get an understanding of the existing scenario.

04. DATA VISUALIZATION
For each parameter, the dashboard provides some analysis in the form of data tiles and charts.

While downloading data, the users can customise the data timeframe that is required to be downloaded in multiple image and pdf formats available.
